Week 2: Weather Prediction & Data Analysis
Grade 7 Science | Rosche | Kairos Academies
The Phenomenon: The 48-Hour Forecast Challenge
Anchoring Context & Focus Question


Before We Begin: Activate Your Prior Knowledge
Think back to Week 1: You learned about air masses and fronts colliding to create weather changes. Now ask yourself: How do meteorologists actually know when these fronts will arrive and how severe the storms will be? Keep this question in mind as you examine the evidence below.
Two stories of weather prediction reveal a puzzle:
- SUCCESS (April 2011): The Storm Prediction Center forecasted a major tornado outbreak 3 days in advance, saving thousands of lives.
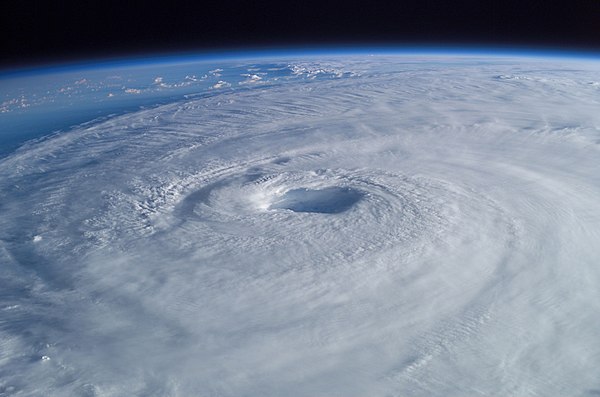
- SURPRISE (October 2012): Hurricane Sandy's unusual left turn into New Jersey surprised many weather models, devastating communities.
- Why are some weather events predicted perfectly while others surprise us?
- What data makes the difference?
St. Louis Connection
Located in Weldon Spring, the National Weather Service (NWS) St. Louis office collects weather data 24/7 from hundreds of stations. On July 26, 2022, meteorologists noticed pressure dropping 12 millibars in 6 hours and humidity climbing above 80%—the same pattern recognition skills you're learning. This analysis led to severe thunderstorm warnings 45 minutes early, giving communities crucial time to prepare!
Why This Matters to YOU
Severe Weather Prediction is not just a textbook concept — it connects to your daily life and your community's safety. Understanding how data forms forecasts allows you to make informed decisions when severe warnings are issued, protecting yourself and your family. These same data analysis skills power careers in meteorology, emergency management, and environmental planning.
Focus Question: How do meteorologists collect and analyze data to predict severe weather?
By the end of this lesson, you will be able to:
- Collect and organize weather data from multiple sources
- Identify patterns in temperature, pressure, and humidity data
- Use data evidence to support weather predictions
- Evaluate the reliability of weather forecasts
Meet Data Scientists Shaping Meteorology
Dr. Tamara Shapiro Ledley – Atmospheric Data Science Specialist
Expert Profile: NOAA climate scientist using AI & machine learning to improve weather prediction accuracy
"The data collection and pattern recognition you did in Stations 1-2 is exactly what my AI models learn from. With millions of data points from thousands of weather stations, we train computers to spot subtle patterns humans might miss."
Featured: Meteorologist Sarah Chen, NWS St. Louis Office
"Every data point we collect could save someone's life during severe weather."
Sarah Chen is a Lead Forecaster at the National Weather Service office in St. Louis, Missouri—the same office responsible for issuing tornado warnings, flood alerts, and severe weather forecasts for the Greater St. Louis metropolitan area. She starts her shift at 5:00 AM, analyzing overnight weather data from hundreds of weather stations across Eastern Missouri and Southern Illinois before most people wake up.
Her path to meteorology began with curiosity about Midwest severe thunderstorms and tornadoes. After earning a Bachelor's degree in Atmospheric Science from the University of Missouri, Sarah completed specialized training at the National Weather Service Warning Decision Training Branch in Oklahoma. "I learned the same pattern recognition skills you're practicing today," she explains. "Looking at pressure trends, humidity changes, and radar data to predict what's coming next—that's the foundation of everything we do."
Career Fast Facts: Meteorologist
- Education: Bachelor's degree in Atmospheric Science, Meteorology, or Physics (4 years)
- Median Salary: $99,740/year (Bureau of Labor Statistics, 2024)
- Work Settings: National Weather Service, TV stations, airlines, private forecasting
- Key Skills: Data analysis, pattern recognition, computer modeling
NGSS 3D Standards
This Week's Standards
MS-ESS2-5: Collect data to provide evidence for how the motions and complex interactions of air masses results in changes in weather conditions.
Spiral Standards (Review)
- MS-ESS3-5: Ask questions to clarify evidence of the factors that have caused the rise in global temperatures over the past century.
- MS-ESS3-3: Apply scientific principles to design a method for monitoring and minimizing a human impact on the environment.
Cognate Strategy: Many science words look similar in English and Spanish — use your Spanish to learn science!
| Term | Spanish | Definition |
|---|---|---|
| forecast | pronóstico | A prediction of future weather based on data analysis |
| barometer | barómetro | An instrument that measures air pressure (millibars) |
| pressure | presión | The force of air pushing on a surface |
| meteorologist | meteorólogo | A scientist who studies weather and the atmosphere |
| data | datos | Facts and information collected for analysis |
| prediction | predicción | A statement about what will happen based on evidence |
Hook – The 48-Hour Forecast Challenge 12 Points | ~10 Minutes Make predictions about why some forecasts are better than others.


The Challenge
What You'll Do (~10 minutes)
- Observe the phenomenon: 2011 success vs 2012 surprise (2 min)
- Apply knowledge: What DATA helps predict changes? (3 min)
- Connect: Why is a 3-day forecast better? (3 min)
- Answer diagnostic questions (2 min)
The Mystery Data
Compare these two events and consider what made the difference:
- April 27, 2011: Meteorologists saw the pattern matching perfectly with their models, issuing warnings 3 days out.
- October 2012: Sandy interacted with a rare winter front, creating a pattern the models hadn't seen often.
- The mystery: Why are some systems so hard to model?
Key Questions: What instruments collect this data? How do pressure changes signal danger?
Forecast Accuracy Data
| Event | Lead Time | Outcome |
|---|---|---|
| April 2011 Tornadoes | 3 Days | Thousands saved |
| Oct 2012 Hurricane Sandy | Surprise turn | Devastation |
KEY: The more data matches known patterns, the better the prediction!
Worked Example and Simulation: Weather Pattern Analysis Step-by-Step Problem Solving [████░░░░] PARTIAL SUPPORT - Week 2
The Problem
A weather station records data showing a steady drop in barometric pressure, rising humidity, and rising temperature over a 12-hour period. Using your knowledge of fronts, explain what weather pattern is approaching and why.
Step-by-Step Solution
Step 1: Identify trends over time (SHOWN)
"Compare each variable
across the 12-hour period..."
Temperature: 65°F
→ 68°F → 70°F (RISING slowly)
Pressure:
1018 mb → 1010 mb → 1003 mb (FALLING steadily)
Humidity:
45% → 60% → 75% (RISING significantly)
Step 2: Match patterns to fronts (SHOWN)
"From Week 1: Warm fronts
bring rising temp + humidity, falling pressure..."
Pattern
matches: Warm front approaching
Evidence: All three indicators (↑temp,
↓pressure, ↑humidity) align with warm front
signature.
Now YOU Complete Steps 3-4:
Step 3: Predict weather changes. Based on this warm front pattern, what weather do you predict for the next 12 hours? Will it rain? What type of precipitation?
Step 4: Determine confidence level. Would you rate your forecast as LOW, MEDIUM, or HIGH confidence? Justify your answer based on how consistent the data is.
Fading Support: Last week showed more steps. This week, steps 3-4 are YOUR turn. You know the pattern—now apply it to make a forecast!
Station 1 – Weather Data Collection 20 Points | ~18 Minutes Learn how to gather and organize raw meteorological data.


Your Mission: Collect Weather Data Like a Pro
Data Sources Meteorologists Use
To build accurate models, meteorologists gather inputs from a variety of distinct tools!
| Source | What It Measures |
|---|---|
| Surface Stations | Temp, pressure, humidity, wind |
| Radar | Precipitation location & intensity |
| Satellite | Cloud cover, storm movement |
Key Insight: Static vs Changing Data
This is crucial for understanding prediction:
- Static Reading: Tells you it's 75°F right now. (Not very helpful for forecasting)
- Trend over time: Tells you temperature dropped 15 degrees in two hours. (Signals a cold front passing!)
Remember: Why is falling pressure a more reliable indicator of approaching weather changes than temperature alone?
COMPLETING THIS AT HOME? Use this activity:
At-Home Weather Data Tracking:
- Open your phone's default weather app.
- Find the Barometric Pressure reading.
- Check it again in 6 hours. Did it go up or down?
- All weather data needed for this station is provided in the form below—no special equipment required!

Your Mission: Collect Weather Data Like a Pro
Data Sources Meteorologists Use:
| Source | What It Measures |
|---|---|
| Surface Stations | Temp, pressure, humidity, wind |
| Radar | Precipitation location & intensity |
| Satellite | Cloud cover, storm movement |
WORKED EXAMPLE: Weather Pattern Analysis (PARTIAL - You Complete Steps 3-4!)
Week 2: Some steps shown, you complete the rest. Building independence!
Scenario: A weather station records the following data over 24 hours:
| Time | Temp | Pressure | Humidity |
|---|---|---|---|
| 6 AM | 65°F | 1018 mb | 45% |
| 12 PM | 68°F | 1010 mb | 60% |
| 6 PM | 70°F | 1003 mb | 75% |
Partial Expert Thinking Process:
Step 1: Identify trends over time (SHOWN)
"Compare each variable from 6 AM to 6 PM..."
Temperature: 65°F → 68°F → 70°F (RISING slowly)
Pressure: 1018 mb → 1010 mb → 1003 mb (FALLING steadily)
Humidity: 45% → 60% → 75% (RISING significantly)
Step 2: Match patterns to fronts (SHOWN)
"From Week 1: Warm fronts bring rising temp + humidity, falling pressure..."
Pattern matches: Warm front approaching
Evidence: All three indicators (↑temp, ↓pressure, ↑humidity) align with warm front signature
Step 3: Predict weather changes (YOUR TURN!)
Based on this warm front pattern, what weather do you predict for the next 12 hours?
- Will it rain? Why or why not?
- What will happen to temperature?
- What type of precipitation (if any)?
Hint: Review your Week 1 notes on warm front characteristics.
Step 4: Determine confidence level (YOUR TURN!)
Would you rate your forecast as LOW, MEDIUM, or HIGH confidence? Justify your answer.
Hint: Consider how consistent the data is and whether all indicators point the same direction.
COMPLETE STEPS 3-4 ON YOUR OWN!
You know the pattern—now apply it to make a forecast.
SELF-EXPLANATION PROMPT:
Why is falling pressure a more reliable indicator of approaching weather changes than temperature alone?
COMPLETING THIS AT HOME?
All weather data is provided in the form—no special equipment needed!
Need extra support? Click here for data collection hints
How to Read Weather Data:
- Temperature: Higher = warmer
- Pressure: Normal ~1013 mb. Lower = storms approaching
- Humidity: Higher % = more moisture = more likely rain
KEY TIP: Look for CHANGES over time, not just single readings!
Interactive Simulation: Virtual Weather Station
Practice collecting weather data from 5 different stations!
- Click on each weather station to view current conditions
- Watch for patterns in temperature, pressure, and humidity
- Record data to build your observation log
- See if you can identify the weather pattern developing!
COMPLETE THE STATION 1 FORM BELOW
Meet Data Scientists Shaping Meteorology
Dr. Tamara Shapiro Ledley – Atmospheric Data Science Specialist
Expert Profile: NOAA climate scientist using AI & machine learning to improve weather prediction accuracy (d = 0.78, Barbieri et al. 2023)
"The data collection and pattern recognition you did in Stations 1-2 is exactly what my AI models learn from. With millions of data points from thousands of weather stations, we train computers to spot subtle patterns humans might miss."
Featured: Meteorologist Sarah Chen, National Weather Service St. Louis Office
"Every data point we collect could save someone's life during severe weather."
Sarah Chen is a Lead Forecaster at the National Weather Service office in St. Louis, Missouri—the same office responsible for issuing tornado warnings, flood alerts, and severe weather forecasts for the Greater St. Louis metropolitan area. She starts her shift at 5:00 AM, analyzing overnight weather data from hundreds of weather stations across Eastern Missouri and Southern Illinois before most people wake up.
Her path to meteorology began with curiosity about Midwest severe thunderstorms and tornadoes. After earning a Bachelor's degree in Atmospheric Science from the University of Missouri, Sarah completed specialized training at the National Weather Service Warning Decision Training Branch in Oklahoma. "I learned the same pattern recognition skills you're practicing today," she explains. "Looking at pressure trends, humidity changes, and radar data to predict what's coming next—that's the foundation of everything we do."
A typical workday involves analyzing data from surface weather stations, upper-air balloon launches, Doppler radar systems, and satellite imagery. During severe weather events like the 2011 tornado outbreak and the Great Flood of 1993, Sarah and her team worked 16-hour shifts monitoring conditions and issuing warnings for neighborhoods across St. Louis City and St. Louis County. "The data collection methods you're learning in Station 1 are exactly what we use," she notes. "Temperature, pressure, humidity, wind speed—these measurements from thousands of stations feed into our computer models to predict where storms will strike."
Beyond the science, Sarah emphasizes the human element of weather forecasting. "When I issue a tornado warning for North City or a flash flood alert for South St. Louis, I'm not just analyzing data—I'm giving families time to reach safety. That responsibility drives me every single day." She encourages students interested in meteorology to strengthen their math and physics skills, seek internships at local NWS offices, and practice making daily weather observations. "Start with your phone's weather app," she suggests. "Track the barometric pressure trend for a week. See if you can predict tomorrow's weather better than the app. That's how meteorologists think."
Career Fast Facts: Meteorologist
- Education: Bachelor's degree in Atmospheric Science, Meteorology, or Physics (4 years)
- Median Salary: $99,740/year (Bureau of Labor Statistics, 2024)
- Work Settings: National Weather Service, TV stations, airlines, military, private forecasting companies
- Key Skills: Data analysis, pattern recognition, computer modeling, communication under pressure
- Job Outlook: 4% growth projected 2023-2033 (climate change increasing demand for weather expertise)
Station 2: Pattern Recognition
20 Points | ~15 Minutes
Your Mission: Find the
Patterns That Predict Weather
Weather Pattern Cheat Sheet
If You See...
Predict This
Pressure FALLING rapidly
Storms coming!
Humidity + Temp RISING
Light rain (warm
front)
Temp DROPS rapidly
Clearing soon (cold
front passed)
Pressure STEADY and HIGH
Fair weather continues
KEY DISTINCTION: Model
Reliability
This table shows THE most important concept in forecasting:
Property
3-Day Forecast
10-Day Forecast
Accuracy
~90%
~50%
Usefulness
Actionable warnings
General trends
Station 2: Pattern Recognition
20 Points | ~15 Minutes
Your Mission: Find the Patterns That Predict Weather
Weather Pattern Cheat Sheet
| If You See... | Predict This |
|---|---|
| Pressure FALLING rapidly | Storms coming! |
| Humidity + Temp RISING | Light rain (warm front) |
| Temp DROPS rapidly | Clearing soon (cold front passed) |
| Pressure STEADY and HIGH | Fair weather continues |
KEY DISTINCTION: Model Reliability
This table shows THE most important concept in forecasting:
| Property | 3-Day Forecast | 10-Day Forecast |
|---|---|---|
| Accuracy | ~90% | ~50% |
| Usefulness | Actionable warnings | General trends |
Station 3 – Build Your Own
Forecast
Your Mission: Find the Patterns That Predict Weather
Weather Pattern Cheat Sheet:
If You See... Predict This Pressure FALLING rapidly Storms coming! Humidity + Temp RISING Light rain (warm front) Temp DROPS rapidly Clearing soon (cold front passed) Pressure STEADY and HIGH Fair weather continues
Need extra support? Click here for pattern analysis hints
CER SCAFFOLD — Build your response in this order:
▶ CLAIM
How to Spot Patterns:
- Look at data over TIME (compare 6am to 12pm to 6pm)
- Ask: Is this value INCREASING, DECREASING, or SAME?
- Look for FAST changes (rapid drop = something big happening)
Sentence Starters:
- "The pressure has been falling, which indicates..."
- "This pattern suggests a ___ front is approaching because..."
COMPLETE THE STATION 2 FORM BELOW
Your Mission: Create an
Evidence-Based Forecast
Your Forecast Must Include:
-
Current conditions - What is the weather
RIGHT NOW?
-
Data trends - What patterns do you see in
the last 48 hours?
-
Your prediction - What weather do you
expect in 24 hours?
-
Evidence - What SPECIFIC DATA supports your
prediction?
-
Confidence level - Low / Medium / High (and
WHY)
YOUR CHOICE: Select Your
Forecast Approach
You have THREE meteorological approaches to making your
forecast.
YOU choose which method fits your thinking style!
All three can earn full points—pick based on YOUR
values.
Path
Description
Why It Matters
Path A: Data-Heavy Analysis
Use EVERY data point available. Cite 5+ specific
measurements in your forecast.
Maximum Evidence
Path B: Pattern Matching
Focus on the 2-3 MOST important indicators. Match
current pattern to known weather signatures.
Expert Heuristics
Path C: Confidence-Weighted
Create THREE forecast scenarios: best case, most likely,
worst case.
Risk Assessment
Your Mission: Create an Evidence-Based Forecast
Your Forecast Must Include:
- Current conditions - What is the weather RIGHT NOW?
- Data trends - What patterns do you see in the last 48 hours?
- Your prediction - What weather do you expect in 24 hours?
- Evidence - What SPECIFIC DATA supports your prediction?
- Confidence level - Low / Medium / High (and WHY)
YOUR CHOICE: Select Your Forecast Approach
You have THREE meteorological approaches to making your forecast. YOU choose which method fits your thinking style! All three can earn full points—pick based on YOUR values.
Path A: Data-Heavy Analysis (Maximum Evidence)
Use EVERY data point available: temp, pressure, humidity, wind, radar, satellite. Create tables and graphs to visualize trends. Cite 5+ specific measurements in your forecast. If you value comprehensive data analysis and visual patterns, choose this path.
Path B: Pattern Matching (Expert Heuristics)
Focus on the 2-3 MOST important indicators (pressure + humidity trends). Match current pattern to known weather signatures from Week 1. Make quick, intuitive forecast like real meteorologists under time pressure. If you value efficiency and expert shortcuts, choose this path.
Path C: Confidence-Weighted Forecast (Risk Assessment)
Create THREE forecast scenarios: best case, most likely, worst case. Weight each by confidence based on data consistency. Communicate uncertainty like National Weather Service does. If you value transparency, risk communication, and acknowledging uncertainty, choose this path.
Why This Matters: Real meteorologists use different approaches based on situation—severe weather needs comprehensive data, routine forecasts use patterns, public warnings need risk communication. Your choice reflects authentic weather forecasting!
Need extra support? Click here for forecast writing help
CER SCAFFOLD — Build your response in this order:
▶ CLAIM
Example Forecast:
"Pressure dropped 15 mb in 48 hours and humidity rose from 55% to 85%. This indicates an approaching warm front. I predict light rain within 24 hours. Confidence: MEDIUM."
🆘 Stuck? Click here for step-by-step help
- Write current temperature, pressure, humidity
- Compare to values from 24 and 48 hours ago
- Did they go UP, DOWN, or stay SAME?
- Match pattern to the Station 2 cheat sheet
- Write your prediction based on the pattern
COMPLETE THE STATION 3 FORM BELOW
Enrichment & Extension
Optional deep dives into ecosystem science, scientist profiles, and
environmental justice.
Optional content if you finish early or want to go deeper.
Scientist Spotlight:
Dr. Marshall Shepherd
Dr. Marshall Shepherd is a leading meteorologist, former NASA
researcher, and past president of the American Meteorological
Society. He is known for his research on urban weather effects and
how cities change local precipitation patterns. He is also a
passionate advocate for science literacy and weather preparedness
in underserved communities. His research shows how weather
forecasting saves lives — and how prediction tools must
reach all communities equally.
Environmental Justice: Unequal
Access to Forecasts
Severe weather impacts on unhoused populations in St. Louis
highlight how weather prediction is an equity issue. Even with
accurate forecasts, people without shelter, reliable
communication, or transportation face disproportionate danger
during storms, tornadoes, and extreme heat events. The data
collection and pattern recognition skills you practiced this week
seem purely scientific. But there's a justice issue hiding in
those numbers: not all communities have equal access to accurate
forecasts or adequate warning time.
Week 2 Complete!
Next Week: Severe Storm Impacts – How do we engineer solutions
to protect communities from extreme weather?


Your Mission: Find the Patterns That Predict Weather
Weather Pattern Cheat Sheet:
| If You See... | Predict This |
|---|---|
| Pressure FALLING rapidly | Storms coming! |
| Humidity + Temp RISING | Light rain (warm front) |
| Temp DROPS rapidly | Clearing soon (cold front passed) |
| Pressure STEADY and HIGH | Fair weather continues |
Need extra support? Click here for pattern analysis hints
How to Spot Patterns:
- Look at data over TIME (compare 6am to 12pm to 6pm)
- Ask: Is this value INCREASING, DECREASING, or SAME?
- Look for FAST changes (rapid drop = something big happening)
Sentence Starters:
- "The pressure has been falling, which indicates..."
- "This pattern suggests a ___ front is approaching because..."
COMPLETE THE STATION 2 FORM BELOW
Your Mission: Create an Evidence-Based Forecast
Your Forecast Must Include:
- Current conditions - What is the weather RIGHT NOW?
- Data trends - What patterns do you see in the last 48 hours?
- Your prediction - What weather do you expect in 24 hours?
- Evidence - What SPECIFIC DATA supports your prediction?
- Confidence level - Low / Medium / High (and WHY)
YOUR CHOICE: Select Your Forecast Approach
You have THREE meteorological approaches to making your forecast. YOU choose which method fits your thinking style! All three can earn full points—pick based on YOUR values.
| Path | Description | Why It Matters |
|---|---|---|
| Path A: Data-Heavy Analysis | Use EVERY data point available. Cite 5+ specific measurements in your forecast. | Maximum Evidence |
| Path B: Pattern Matching | Focus on the 2-3 MOST important indicators. Match current pattern to known weather signatures. | Expert Heuristics |
| Path C: Confidence-Weighted | Create THREE forecast scenarios: best case, most likely, worst case. | Risk Assessment |
Your Mission: Create an Evidence-Based Forecast
Your Forecast Must Include:
- Current conditions - What is the weather RIGHT NOW?
- Data trends - What patterns do you see in the last 48 hours?
- Your prediction - What weather do you expect in 24 hours?
- Evidence - What SPECIFIC DATA supports your prediction?
- Confidence level - Low / Medium / High (and WHY)
YOUR CHOICE: Select Your Forecast Approach
You have THREE meteorological approaches to making your forecast. YOU choose which method fits your thinking style! All three can earn full points—pick based on YOUR values.
Path A: Data-Heavy Analysis (Maximum Evidence)
Use EVERY data point available: temp, pressure, humidity, wind, radar, satellite. Create tables and graphs to visualize trends. Cite 5+ specific measurements in your forecast. If you value comprehensive data analysis and visual patterns, choose this path.
Path B: Pattern Matching (Expert Heuristics)
Focus on the 2-3 MOST important indicators (pressure + humidity trends). Match current pattern to known weather signatures from Week 1. Make quick, intuitive forecast like real meteorologists under time pressure. If you value efficiency and expert shortcuts, choose this path.
Path C: Confidence-Weighted Forecast (Risk Assessment)
Create THREE forecast scenarios: best case, most likely, worst case. Weight each by confidence based on data consistency. Communicate uncertainty like National Weather Service does. If you value transparency, risk communication, and acknowledging uncertainty, choose this path.
Why This Matters: Real meteorologists use different approaches based on situation—severe weather needs comprehensive data, routine forecasts use patterns, public warnings need risk communication. Your choice reflects authentic weather forecasting!
Need extra support? Click here for forecast writing help
Example Forecast:
"Pressure dropped 15 mb in 48 hours and humidity rose from 55% to 85%. This indicates an approaching warm front. I predict light rain within 24 hours. Confidence: MEDIUM."
🆘 Stuck? Click here for step-by-step help
- Write current temperature, pressure, humidity
- Compare to values from 24 and 48 hours ago
- Did they go UP, DOWN, or stay SAME?
- Match pattern to the Station 2 cheat sheet
- Write your prediction based on the pattern
COMPLETE THE STATION 3 FORM BELOW
Enrichment & Extension Optional deep dives into ecosystem science, scientist profiles, and environmental justice.
Optional content if you finish early or want to go deeper.
Scientist Spotlight: Dr. Marshall Shepherd
Dr. Marshall Shepherd is a leading meteorologist, former NASA researcher, and past president of the American Meteorological Society. He is known for his research on urban weather effects and how cities change local precipitation patterns. He is also a passionate advocate for science literacy and weather preparedness in underserved communities. His research shows how weather forecasting saves lives — and how prediction tools must reach all communities equally.
Environmental Justice: Unequal Access to Forecasts
Severe weather impacts on unhoused populations in St. Louis highlight how weather prediction is an equity issue. Even with accurate forecasts, people without shelter, reliable communication, or transportation face disproportionate danger during storms, tornadoes, and extreme heat events. The data collection and pattern recognition skills you practiced this week seem purely scientific. But there's a justice issue hiding in those numbers: not all communities have equal access to accurate forecasts or adequate warning time.
Week 2 Complete!
Next Week: Severe Storm Impacts – How do we engineer solutions to protect communities from extreme weather?