Week 2: Seafloor Spreading & Continental Drift
Grade 7 Science | Rosche | Kairos Academies
MS-ESS2-3 Earth's Systems
The Phenomenon: The Underwater Mountain Mystery
Anchoring Context & Focus Question
Driving Question for the Week
How can mountains exist on the ocean floor?
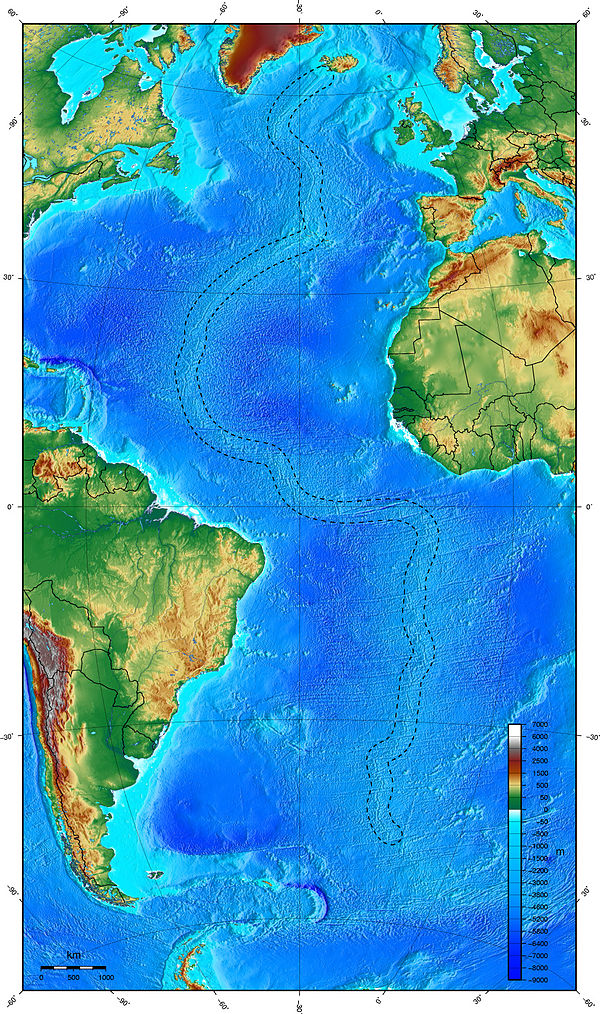
The Mid-Atlantic Ridge is a 10,000-mile underwater mountain range running down the center of the Atlantic Ocean. New rock is forming there right now — and it is slowly pushing Europe and North America 2.5 centimeters farther apart every year. This week you will figure out how scientists know this and what it means for Earth's surface.
Connection to Week 1
Last week you learned that divergent boundaries are places where plates pull apart. Think about this question before you start:
"We learned divergent boundaries pull plates apart. What happens to the gap that forms between them?"
Write your prediction on your worksheet before moving on.
Learning Targets — By the end of this week you will be able to:
- Interpret magnetic stripe evidence to explain how seafloor spreading works
- Use multiple lines of evidence (fossils, rock formations, climate, coastlines) to support continental drift
- Explain the plate recycling cycle — how spreading at ridges and subduction at trenches keep the total amount of crust roughly constant
- Design a measurement system that could detect plate movement with real technology
What You Will Do Today
- Hook: Examine real ocean floor depth data and notice a pattern
- Worked Example: Learn how to read magnetic stripe diagrams (hardest concept — pay attention!)
- Station 1: Analyze magnetic stripe data as evidence for seafloor spreading
- Station 2: Evaluate five types of evidence for continental drift
- Station 3: Design a technology system to detect plate movement
- Exit Ticket: Synthesize everything you learned
Vocabulary
Cognate Strategy: Many science words look similar in English and Spanish — use your Spanish to learn science!
| Term | Spanish | Definition |
|---|---|---|
| magnetic reversal | inversión magnética | When Earth's magnetic poles switch direction |
| polarity | polaridad | The direction of a magnetic field (normal or reversed) |
| spreading rate | tasa de expansión | Speed at which new seafloor is created at mid-ocean ridges |
| mid-ocean ridge | dorsal oceánica | Underwater mountain chain where new seafloor forms |
| seafloor spreading | expansión del fondo oceánico | Process of creating new oceanic crust at mid-ocean ridges |
| symmetry | simetría | Balanced pattern on both sides of a mid-ocean ridge |
| evidence | evidencia | Scientific observations and data that support a claim |
| Continental Drift | Deriva continental | The theory that Earth's continents were once joined and have slowly moved apart over millions of years |
| Pangaea | Pangea | The supercontinent that existed about 200 million years ago, before breaking apart into today's continents |
| Subduction | Subducción | The process where one tectonic plate slides beneath another, recycling old crust back into the mantle |
| Fossil Distribution | Distribución de fósiles | The pattern of where specific fossil types are found across different continents, used as evidence for continental drift |
Hook – The Underwater Mountain
Mystery
Explore mid-Atlantic Ridge bathymetry data.
The Challenge: What's on the Ocean Floor?
In the 1950s, a geologist named Marie Tharp was mapping the Atlantic Ocean floor using sonar depth measurements. Everyone assumed the ocean floor was flat. What she found shocked the world.
Look at the depth data in the form below. You are going to do what Tharp did — find the pattern hidden in the numbers.
Stop & Think — Before You Open the Form
If you were in a submarine traveling away from the center of the Atlantic Ocean, what would you expect the depth of the water above you to do? Pick one prediction:
- Get deeper as you move away from the center
- Stay the same depth the whole way
- Start shallow in the middle, then get deeper toward the edges
Write your prediction on your worksheet, then open the form to see the real data.
Worked Example and Simulation – Interpreting
Magnetic Stripe Patterns
The Scenario
Scientists drilled rock samples from the ocean floor at different distances from the Mid-Atlantic Ridge. They measured the age of the rock and the magnetic polarity recorded in the iron minerals. The table below shows what they found on both sides of the ridge.
| Distance from Ridge | Left Side Polarity | Rock Age | Right Side Polarity |
|---|---|---|---|
| 0 km (at ridge) | Normal (N) | 0–1 million yrs | Normal (N) |
| 50 km | Reversed (R) | 3–5 million yrs | Reversed (R) |
| 100 km | Normal (N) | 8–10 million yrs | Normal (N) |
| 150 km | Reversed (R) | 14–16 million yrs | Reversed (R) |
Step 1: Notice the Pattern on Each Side
Read down the "Left Side Polarity" column. The pattern is: N → R → N → R (alternating). Now read the "Right Side Polarity" column. The pattern is: N → R → N → R — exactly the same.
Key observation: The left side and right side are mirror images of each other. Every stripe on the left has an identical twin stripe at the same distance on the right.
Step 2: Connect Polarity to Earth's Magnetic History
Why does the polarity alternate? Earth's magnetic field has flipped direction many times in its history — this is called a magnetic reversal. When lava erupts at the ridge and cools into solid rock, the iron minerals inside lock in whichever direction Earth's field is pointing at that moment.
Think of it like a tape recorder: each new stripe of rock records a snapshot of Earth's magnetic field at the time it formed. Older rocks (farther from ridge) recorded older reversals.
Step 3: Use the Pattern to Prove Spreading
Look at the ages in the table. The rock at the ridge is 0–1 million years old. Rock at 150 km is 14–16 million years old. The rock gets older as you move away from the ridge.
This means the ridge is constantly making new rock. Old rock gets pushed outward. The seafloor is literally spreading apart — like a conveyor belt moving in both directions from the center.
Step 4: State the Claim
Here is how a scientist would write up this finding:
"The symmetric magnetic stripe pattern on both sides of the Mid-Atlantic Ridge, with rock age increasing with distance from the ridge, provides evidence that new seafloor is continuously formed at the ridge and spread outward in both directions. This supports the hypothesis of seafloor spreading."
Common Mistake — Don't Fall for This!
Wrong thinking: "The stripes formed randomly, and it's just a coincidence that the two sides look similar."
Why it's wrong: Random processes don't produce perfect mirror images across thousands of kilometers. The symmetry is exact because both sides of the ridge are made of the same rock that split apart. One piece went left, one piece went right — they started as identical twins.
The rule: Symmetry = the ridgeline is the center where new crust forms. Period.

Now You Try
Imagine a new ridge where scientists collect the following data:
| Distance from Ridge | Left Side Polarity | Right Side Polarity |
|---|---|---|
| 0 km | Normal | Normal |
| 30 km | Reversed | ? |
| 60 km | Normal | ? |
Fill in the "?" values and write one sentence explaining why you chose those values. Record your answer on your worksheet before moving to Station 1.
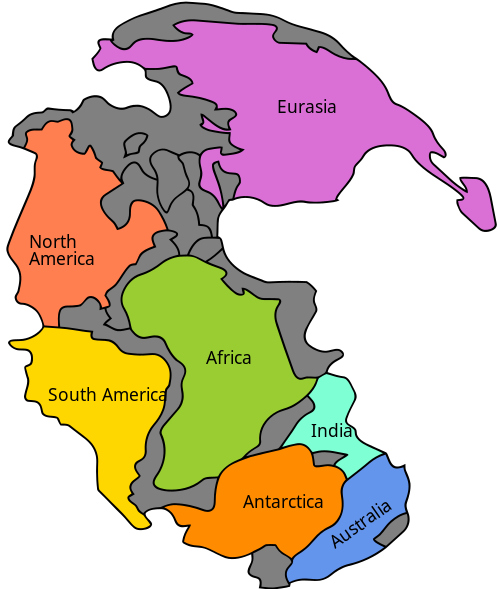
Simulation: Pangaea Puzzle
Station 1 – Seafloor Spreading
Evidence
Interpret magnetic evidence for seafloor spreading.
What You Are Doing
You just learned in the Worked Example how to read magnetic stripe patterns. Now you will apply that skill to real data from the Mid-Atlantic Ridge. You will decide whether the evidence supports or does not support the claim that seafloor spreading is happening.
Remember: good scientists look at multiple features of the data — the pattern of stripes, the symmetry between sides, and how age changes with distance.
Reference: Magnetic Stripe Data — Mid-Atlantic Ridge
| Distance from Ridge | Polarity (Left) | Approximate Age | Polarity (Right) |
|---|---|---|---|
| 0 km (ridge center) | Normal | < 1 million yrs | Normal |
| 50 km | Reversed | 3–5 million yrs | Reversed |
| 100 km | Normal | 8–10 million yrs | Normal |
| 200 km | Reversed | 20–25 million yrs | Reversed |
| 500 km | Normal | ~80 million yrs | Normal |
Near continents (2,000+ km from ridge), rock can be up to 200 million years old.
Support: Sentence Starters
Use these if you are not sure how to write your answers:
- "The magnetic stripe pattern on the left side is _____ and the right side is _____, which shows that the pattern is [symmetric / asymmetric]."
- "As distance from the ridge increases, the rock age [increases / decreases / stays the same]. This supports seafloor spreading because _____."
- "This evidence [supports / does not support] the claim that new crust is forming at the ridge because _____."


Station 2 – Pangaea Puzzle
Investigation
Multiple lines of evidence for continental drift.
The Big Idea
About 200 million years ago, all of Earth's continents were joined into one giant landmass called Pangaea. They slowly drifted apart — and they are still moving today. How do scientists know this? Not from one piece of evidence, but from five completely different types that all point to the same conclusion.
Study the table below carefully. You will use this information to answer the form questions.
Five Lines of Evidence for Continental Drift
| Evidence Type | What Scientists Found | Why It Matters |
|---|---|---|
| Continental shapes | The eastern coastline of South America and the western coastline of Africa fit together like puzzle pieces | Suggests the continents were once connected and then separated |
| Fossil distribution | Mesosaurus — a small freshwater reptile — is found only in Brazil AND South Africa, separated by 3,000 miles of ocean | Mesosaurus could not swim across an ocean; the two areas must have been connected |
| Rock formations | The Appalachian Mountains (eastern US) match the Caledonian Mountains (Scotland and Norway) — same rock type, same age (~400 million yrs) | These ranges were once a single mountain chain that split when the continents drifted apart |
| Climate evidence | Glacial scratch marks and deposits in now-tropical Africa, India, South America; coal beds (ancient tropical swamp) in Antarctica | Continents must have been in very different positions (near poles or equator) millions of years ago |
| Magnetic stripes | Symmetric stripe patterns at all mid-ocean ridges; rock age increases with distance from ridge | New seafloor forms at ridges and spreads outward, physically pushing continents apart |
Support: Sentence Starters for Your Arguments
- "The _____ evidence supports continental drift because _____."
- "If the continents had never been connected, we would not expect to find _____ in both [location A] and [location B]."
- "The strongest evidence is _____ because _____. The weakest evidence alone would be _____ because _____."
- "Using multiple types of evidence is important because one piece of evidence could be [coincidence / explained another way], but when all five agree, _____."

Station 3 – Design a Plate Movement
Detector
Apply understanding to measurement challenge.
The Engineering Challenge
We know plates are moving. Scientists have proved it with magnetic stripes, fossils, and matching coastlines. But those are all clues from the past. Can you measure plates moving right now?
Your task: design a monitoring system to detect plate movement at three different plate boundaries. You have a budget and precision requirements to work within.
Design Constraints:
- Budget: $500,000 total for a 5-year study
- Precision required: Detect movement as small as 1 mm/year
- Coverage: Must monitor 3 different plate boundaries
Available Technologies
| Technology | Cost per Station | Precision | Trade-offs |
|---|---|---|---|
| GPS Station | $50,000 | 1 mm/year | Needs clear sky; works in remote locations; relatively affordable |
| Laser Ranging | $200,000 | 0.1 mm/year | Very precise but expensive; accuracy affected by bad weather |
| VLBI (radio astronomy) | $150,000 | 0.5 mm/year | Uses distant quasars as reference points; requires multiple dish antennas working together |
| Tide Gauges | $25,000 | 5 mm/year | Cheapest option; measures sea level, not plate position directly; less precise |
Hint: You can mix technologies! Not every boundary needs the same tool.
Exit Ticket – Earth's Dynamic Surface
Integration
Synthesize evidence for seafloor spreading and continental drift.
Before You Submit
You have done a lot of thinking today. The exit ticket will ask you to pull it all together. Here is what you should be able to explain on your own:
- Why magnetic stripe symmetry is evidence for seafloor spreading
- How rock age patterns at ridges support the idea that new crust is forming
- Why scientists need multiple lines of evidence to support a big claim like continental drift
- How spreading at ridges and subduction at trenches keep Earth's total crust area roughly constant
If you are not sure about any of these, look back at your notes from today before starting the ticket.
Enrichment & Extension
Optional content if you finish early or want to go deeper.

Scientist Spotlight: Marie Tharp
Marie Tharp (1920–2006) was an American geologist who created the first comprehensive maps of the ocean floor. In the 1950s, women weren't allowed on research ships, so she analyzed sonar data from shore while her colleague Bruce Heezen collected it at sea. She discovered a massive rift valley running down the center of the Mid-Atlantic Ridge — direct evidence of seafloor spreading. When she first proposed it, Heezen dismissed it as “girl talk.” She persisted, and her maps eventually proved continental drift was real, transforming geology forever.
Environmental Justice: Deep-Sea Mining
The same mid-ocean ridges that create new seafloor also deposit valuable minerals — manganese, cobalt, and rare earth elements — in “nodules” on the ocean floor. Companies now want to mine these deposits for electric vehicle batteries and smartphones. But deep-sea mining could destroy unique ecosystems that took millions of years to develop. The International Seabed Authority debates who benefits: wealthy nations with mining technology, or Pacific Island nations whose waters and fisheries would be disrupted. Understanding plate tectonics helps us weigh the costs of extracting resources from the very processes that shape our planet.
Week 2 Complete!
Next Week: Volcanic Eruption Styles & Magma Properties — why do some volcanoes explode?