Week 4: Fossils, Mass Extinctions & Earth's Changing Life
Grade 7 Science | Rosche
MS-LS4-1 Analyze and interpret data for patterns in the fossil record that document the existence, diversity, extinction, and change of life forms throughout the history of life on Earth under the assumption that natural laws operate today as in the past.
The Phenomenon: Fossils, Mass Extinctions & Earth's Changing Life
Anchoring Context & Focus Question
What does it mean when an entire group of organisms disappears from the rock record at the same time?
In Cycle 7 you have learned to read Earth's rocks (Week 1, rock cycle), to order them in time (Week 2, geologic time scale), and to date them in actual years (Week 3, radiometric dating). This week you use that toolkit to answer a bigger question: what does the rock record tell us about LIFE?
66 million years ago, every non-bird dinosaur disappears from the fossil record at one thin layer of rock — the same layer all over the world. Above that line, mammals take over. Geologists call this the K-Pg boundary. It is not the only time this has happened: it is one of FIVE great mass extinctions in the last 542 million years. The patterns you find this week then let you ask a final, harder question — are we causing a sixth one right now?
Cognate Strategy: Many science words look similar in English and Spanish — use your Spanish to learn science!
| Term | Spanish | Definition |
|---|---|---|
| fossil record | registro fósil | The total collection of all known fossils, read together to show how life has changed over time. |
| index fossil | fósil guía / fósil índice | A fossil from a species that lived only during a narrow time window, used to identify the age of a rock layer. |
| mass extinction | extinción masiva | A short interval of geologic time in which a large fraction of Earth's species disappear from the fossil record together. |
| background extinction rate | tasa de extinción de fondo | The normal, slow rate at which species go extinct between mass-extinction events (about 1 per million species per year). |
| biodiversity | biodiversidad | The variety of species living in a place or on Earth as a whole. |
| K-Pg boundary | límite K-Pg | A thin iridium-rich rock layer marking the extinction of the non-bird dinosaurs 66 million years ago. |
| iridium | iridio | A metal that is rare on Earth's surface but common in asteroids — its spike in the K-Pg layer is evidence of impact. |
| Phanerozoic | Fanerozoico | The eon of "visible life" — the last 541 million years, when complex fossils first appear. |
| stratigraphic column | columna estratigráfica | A diagram showing rock layers stacked from oldest (bottom) to youngest (top) at one location. |
Hook – The Dinosaur Vanishing Act
Anchor on the K-Pg extinction: one thin iridium layer that marks the end of an entire group of organisms.
Hook — The K-Pg Boundary
Look at the stratigraphic column on the right. Below the orange line: dinosaur footprints and bones on every continent. At the line: a single thin layer of clay enriched in iridium (a metal that is rare on Earth’s surface but common in asteroids). Above the line: no dinosaur fossils anywhere on Earth, and the mammals that had been small and rare suddenly diversify into the dominant land animals. This pattern shows up in rock layers on every continent, dated by radiometric methods (Week 3) to 66 million years ago.
Your focus question this week
What does it MEAN when an entire group of organisms disappears from the rock record at the same time? The Hook form (12 pts) starts you on the answer; the three stations build the full pattern; the exit ticket asks you to apply it to today.
Worked Example – Reading the Rock Record with Relative Dating
Worked Example — Three rules for ordering rock layers
Before you read the fossil record, you have to be able to order it. Use the diagram on the right to practice the three rules that turn a column of mystery rocks into a timeline.
1. Law of Superposition (W2 review)
2. Cross-Cutting Relationships
3. Unconformity
Try it: using these three rules, can you put all 5 layers and the dike in order from oldest to youngest? (Answer on the worksheet.)
Station 1 – Reading Life Through Strata
Use index fossils and relative dating to determine when species lived and went extinct across distant sites.
Station 1 — Reading Life Through Strata (20 pts)
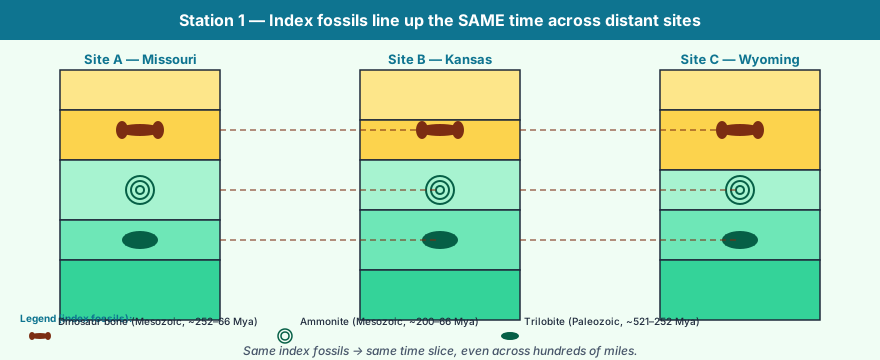
A trilobite, an ammonite, and a dinosaur bone. None of these species lives today — but each one existed during a narrow window of Earth’s history. That makes them index fossils. Find a trilobite in a rock layer in Missouri AND in Kansas AND in Wyoming, and you can say the layers all formed at the same time, even though the rocks look different from place to place.
What to do
- Open the Station 1 form (link below).
- Use the three-site stratigraphic-correlation diagram on the right to answer Q1–Q4 (how index fossils let you line up time across sites).
- Apply superposition + cross-cutting + unconformities (Worked Example) to Q5–Q6 to determine when each index fossil’s species went EXTINCT.
Station 2 – The Big Five Mass Extinctions
Analyze fossil-diversity-through-time data to identify mass-extinction events and reason about their likely causes.
Station 2 — The Big Five (20 pts)
The fossil record shows that global biodiversity does NOT change smoothly. It rises and falls, but five times in the last 542 million years — the Phanerozoic eon — it has crashed in a geologically short interval. Each crash is a mass extinction.
The Big Five (use the diversity graph at right)
- Ordovician–Silurian (~444 Mya) — likely cause: rapid climate cooling + sea-level fall.
- Late Devonian (~372 Mya) — likely cause: ocean anoxia (no oxygen).
- Permian–Triassic (~252 Mya) — “The Great Dying.” >90% of marine species; likely cause: massive Siberian volcanism + climate shift.
- Triassic–Jurassic (~201 Mya) — likely cause: volcanism + climate shift opens niches dinosaurs will fill.
- Cretaceous–Paleogene (K–Pg) (66 Mya) — likely cause: asteroid impact (iridium evidence) + Indian Deccan volcanism. Dinosaurs out, mammals in.
Station 3 – Predict the Sixth Extinction
Apply patterns from past extinctions to evaluate whether we are causing a sixth one right now (bridges to Cycle 8).
Station 3 — Predict the Sixth Extinction (25 pts)
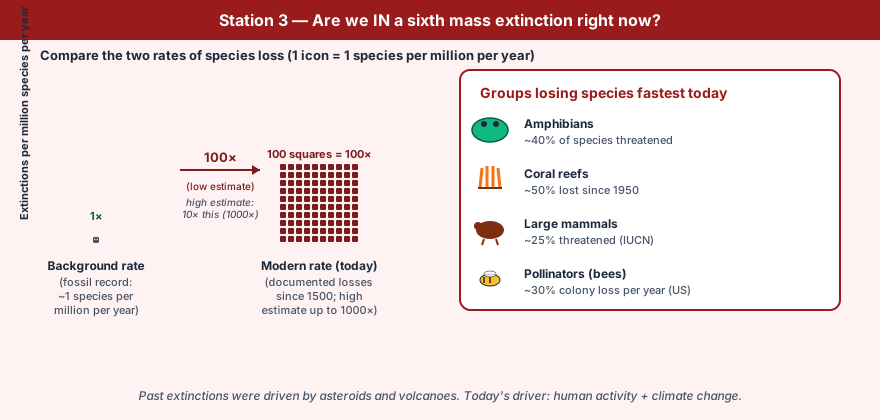
The fossil record sets a baseline: between mass extinctions, species die out at a slow background rate of about 1 species per million per year. Today’s measured rate is roughly 100–1000× higher.
Three patterns from the Big Five — do they fit today?
- Rate spike — species disappear far faster than the background rate. (Today: yes, see the graph at right.)
- Broad taxonomic reach — the loss is not just one group; many groups crash together. (Today: amphibians, coral reefs, large mammals, pollinators are all in steep decline.)
- A planetary driver — past extinctions had asteroids, supervolcanoes, or rapid climate shifts. (Today: human-caused climate change + habitat loss + invasive species.)
Bridge to Cycle 8. Cycle 8 is about ecosystems and biodiversity. Week 3 of C8 specifically assesses how climate-driven habitat shifts put species at risk. The patterns you find this week are the framework you’ll need.
Exit Ticket – Fossils, Extinctions & Life Through Deep Time
Show what you learned this week and connect it back to W1 (rock cycle), W2 (geologic time), and W3 (radiometric dating).
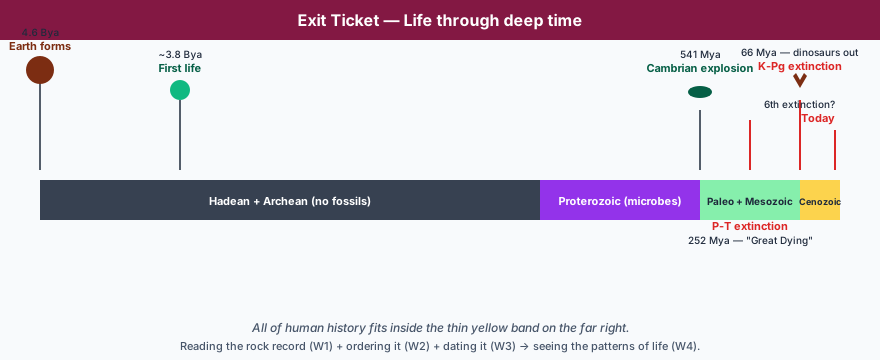
Exit Ticket — Life Through Deep Time (23 pts)
Six short questions, structured to interleave content from this week with content from earlier weeks (research-backed spiral, d = 0.83).
- 2 NEW — index fossils & the Big Five pattern (8 pts)
- 2 SPIRAL — W2 superposition & W3 radiometric dating (8 pts)
- 1 INTEGRATION + SEP-6 — construct an explanation: are we in a sixth extinction? Use evidence from past extinctions + today’s rates (7 pts)
Enrichment & Extension
Optional content if you finish early or want to go deeper.
Scientist Spotlight: Mary Anning
Mary Anning (1799–1847) was an English fossil hunter from Lyme Regis who, beginning at age 12, discovered and excavated some of the most important marine reptile fossils of the 19th century — including the first correctly identified ichthyosaur and the first complete plesiosaur skeleton. Anning was working-class, had no formal education, and was a woman at a time when women were barred from the Geological Society of London. Yet her discoveries fundamentally shaped scientists’ understanding of prehistoric life and helped establish paleontology as a science. Scientists who visited Lyme Regis to buy fossils from her — including major figures in geology — often published findings based on her work without crediting her. Only late in her life did the Geological Society award her an honorary membership. Anning’s story is a reminder that the fossil record she helped excavate belongs to everyone, and that who gets to do science — and who gets credit for it — has never been neutral.
Environmental Justice: The Kimmswick Fossil Beds and Indigenous Land
The Kimmswick Bone Bed, located about 20 miles south of St. Louis, is one of North America’s most significant mastodon fossil sites. In 1979, researchers confirmed this site as evidence that Paleo-Indian people hunted mastodons near St. Louis approximately 12,000–14,000 years ago — among the earliest confirmed evidence of humans and megafauna coexisting in Missouri. Mastodons themselves went extinct as part of the end-Pleistocene megafauna extinction, an event that may have been driven in part by early human hunting pressure. The land that contains this geologic and cultural heritage was taken from Osage and other Indigenous nations through a series of treaties in the 1800s. Today, the Kimmswick site is a state historic site, but the story of whose land it is — and who benefits from its history and tourism — is incomplete without naming that history. The biodiversity loss you study this week did not begin with us, and it does not affect every community equally.
Week 4 Complete!
Next: Cycle 8 — Ecosystems & Biodiversity. C8W3 returns to this week’s sixth-extinction question and assesses extinction risk under modern climate change.