Week 2: Biodiversity & Ecosystem Resilience
Grade 7 Science | Rosche
MS-LS2-2 Ecosystems: Interactions, Energy, and Dynamics
The Phenomenon: How can one small change collapse an entire ecosystem?
Anchoring Context & Focus Question
How can one small change collapse an entire ecosystem?
Cognate Strategy: Many science words look similar in English and Spanish — use your Spanish to learn science!
| Term | Spanish | Definition |
|---|---|---|
| biodiversity | biodiversidad | Variety of life in an ecosystem |
| resilience | resiliencia | Ability of an ecosystem to recover from disturbance |
| monoculture | monocultivo | Agriculture using a single crop repeatedly |
| ecosystem services | servicios ecosistémicos | Benefits humans receive from healthy ecosystems |
| conservation | conservación | Protection and management of biodiversity |
| species | especie | Individual type of organism |
| pollination | polinización | Transfer of pollen enabling plant reproduction |
| food web | red alimentaria | Interconnected food chains showing energy flow in an ecosystem |
Hook – The Collapse Mystery
Investigate how a seemingly minor change can trigger the collapse of an entire ecosystem.
The Collapse Mystery
In the 1980s, sea otters nearly disappeared from Pacific coastal waters due to hunting. Within a decade, sea urchin populations exploded. Urchins ate through kelp forests at catastrophic rates. Without kelp, hundreds of species — fish, harbor seals, bald eagles — lost their habitat and food source. The entire coastal ecosystem unraveled because of one species: the sea otter. How can one small change collapse everything?
Week 1 Connection
What You'll Do
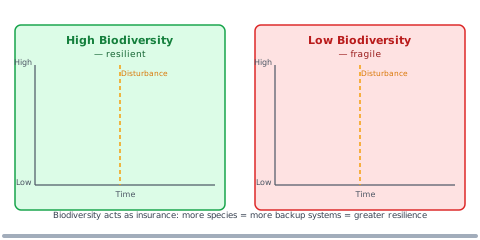
- Compare two ecosystems: high biodiversity vs. low biodiversity — which recovers faster from disturbance?
- Use the Biodiversity Resilience Simulator to test the relationship between species richness and stability
- Identify a keystone species in a Missouri ecosystem and predict what would happen if it disappeared
- Design an ecosystem restoration plan that prioritizes biodiversity for long-term resilience
Worked Example and Simulation – Analyzing Biodiversity Loss
Worked Example and Simulation: Analyzing Species Richness vs. Ecosystem Stability
Problem: Scientists want to know: "Does an ecosystem with more species recover faster from drought than one with fewer species?" You have data from two Missouri prairie plots — Plot A has 45 plant species, Plot B has 8 plant species. After a 2-year drought, how do they compare?
Step 1: Calculate the Shannon Diversity Index (simplified)
Plot A (45 species): If drought kills drought-sensitive species, 10 other species that tolerate dry conditions take over. The ecosystem keeps functioning.
Plot B (8 species): If drought kills the 3 drought-sensitive species, only 5 remain — and if those 5 fill the same ecological role, nothing fills the gap left by the dead 3.
Step 2: The "Insurance Hypothesis"
Step 3: Interpret the Data
Station 1 – Biodiversity-Stability Investigation
Investigate the relationship between biodiversity and ecosystem stability.
Station 1 — Biodiversity-Stability Investigation (20 pts)
Use the Biodiversity Resilience Simulator to test a central scientific question: does more biodiversity always mean more stability? You will manipulate species richness and apply three types of disturbances (drought, invasive species, temperature spike) to compare outcomes.
Simulation Protocol
- Set up 3 ecosystems: Low diversity (5 species), medium diversity (15 species), high diversity (30 species). Record baseline productivity.
- Apply drought disturbance: Run each ecosystem through a 3-year drought. Record productivity loss % and recovery time.
- Apply invasive species: Introduce one invasive species. Which ecosystem resists best? Why?
- Community Biodiversity Audit (citizen science): Using the iNaturalist app, document species you can observe in your school's outdoor area or neighborhood. How does your local area's diversity compare to the simulated ecosystems?
Spiral — Human Impact (Cycle 4)
Station 2 – Keystone Species Analysis
Analyze the role of keystone species in maintaining ecosystem balance.
Station 2 — Keystone Species Analysis (20 pts)
Not all species are equal. A keystone species has effects far larger than its numbers suggest — like the keystone in an arch, remove it and everything collapses. You have four case study data sets. Your job is to identify which species is the keystone in each ecosystem and predict what happens if it disappears.
Case Studies to Analyze
- Sea otter / kelp / sea urchin (Pacific Coast): When otter populations are shown on a graph, they predict urchin and kelp abundance with a ~2-year lag. Identify the keystone and explain the mechanism.
- African elephant / savanna / acacia trees: Elephants knock down trees, opening grassland habitat for zebras and wildebeest. Remove elephants — what happens to the other 40+ species that depend on open grassland?
- American bison / Missouri tallgrass prairie (local!): Bison grazing created patchy vegetation crucial for prairie chickens and grassland-nesting birds. Bison were nearly exterminated by 1900. Today Shaw's Nature Reserve near St. Louis maintains a small bison herd specifically to restore prairie patch structure.
- Your prediction: If the beaver were removed from Missouri rivers, what species would be most affected? Use evidence from the other case studies to support your prediction.
Station 3 – Design an Ecosystem Restoration
Apply biodiversity and resilience principles to design an ecosystem restoration plan.
Station 3 — Design an Ecosystem Restoration (25 pts)
The Missouri River floodplain south of St. Louis once contained thousands of acres of backwater wetlands — among the most biodiverse ecosystems in North America. Between 1940 and 1990, 95% of those wetlands were drained for agriculture and flood control levees. You have been hired as an ecosystem restoration ecologist. Design a plan to restore biodiversity to a degraded 500-acre section of Missouri River floodplain.
Design Requirements
- Triage: identify the biggest biodiversity gap. The current site has 3 plant species (all agricultural weeds), 2 bird species, no amphibians, no native fish. What functional roles are missing? List at least 4.
- Prioritize your first 5 reintroductions. Using the keystone species logic from Station 2, choose the 5 species that will create the most cascading benefits. Justify each with evidence.
- Predict the 10-year outcome. If your plan works, what does the site look like in 10 years? Draw or describe the food web you expect to emerge.
- Evaluate competing solutions (MS-LS2-5): Compare your plan to two alternatives — (a) let it naturally regenerate with no intervention, or (b) plant only one productive crop plant (monoculture). Use biodiversity-stability data from Station 1 to argue which approach is best.
Exit Ticket – Biodiversity Integration
Synthesize learning about biodiversity and ecosystem resilience.
Exit Ticket — Biodiversity Integration (23 pts)
Demonstrate your understanding through 2 new-content questions (biodiversity-stability relationship and keystone species, MS-LS2-2), 2 spiral questions (trophic cascades from Week 1 + human impact from Cycle 4), and 1 integration question [INTEGRATION + SEP-6] that asks you to construct an explanation predicting interaction patterns across multiple ecosystems when a keystone species is lost.
Enrichment & Extension
Optional content if you finish early or want to go deeper.
Scientist Spotlight: E.O. Wilson
E.O. Wilson (1929–2021) was an American biologist and naturalist who spent his life studying ants — and ended up revolutionizing how we understand all of life on Earth. Growing up in Alabama, Wilson lost sight in one eye in a childhood accident, which led him to focus on tiny organisms he could observe up close. He coined the term biodiversity in its modern scientific sense, and his landmark book The Diversity of Life (1992) made the case that Earth's biological richness is not just beautiful — it is the foundation of every ecosystem service humans depend on, from clean water to food production. Wilson's biophilia hypothesis — that humans have an innate emotional connection to other living things — is now used by urban designers in cities like St. Louis to argue for more parks, green corridors, and nature access in underserved neighborhoods. His warning that we are causing a sixth mass extinction through habitat loss remains one of the most urgent messages in science today.
Environmental Justice: Disappearing Missouri River Wetlands
Between 1940 and 1990, the U.S. Army Corps of Engineers channelized the Missouri River — straightening its bends, hardening its banks with rock, and draining its floodplain wetlands — to improve navigation and enable agriculture. Over 95% of Missouri River floodplain wetlands were destroyed. These wetlands were not just wildlife habitat; they filtered agricultural runoff before it reached the Mississippi River, buffered flood peaks that would otherwise devastate downstream communities, and provided hunting and fishing that sustained both Indigenous communities and rural Missouri families for generations. The communities that lost the most — Native nations along the river and low-income farming communities — had almost no say in these decisions. Today, the Great Flood of 1993 (which caused $15 billion in damage in Missouri alone) is partly attributed to the loss of natural floodplain storage. Restoring Missouri River wetlands is an environmental justice issue: it protects the most vulnerable communities from flooding while rebuilding biodiversity that everyone depends on.
Week 2 Complete!
Next Week: Climate Change Impact on Ecosystems — why are coral reefs dying even in protected areas?