Week 3: Urban Heat Island Effect & Solutions
Grade 8 Science | Rosche
The Phenomenon: The Hot City Mystery
Anchoring Context & Focus Question
Why is the city always hotter than the countryside?
Driving Question: Why are cities hotter than the countryside?
Cognate Strategy: Many science words look similar in English and Spanish — use your Spanish to learn science!
| Term | Spanish | Definition |
|---|---|---|
| prototype | prototipo | First working model of a design for testing |
| iteration | iteracion | Repeated cycle of design, test, and improve |
| thermal resistance | resistencia termica | Ability of material to resist heat flow |
| equilibrium | equilibrio | When temperatures become equal on both sides |
| heat | calor | Energy that flows from hot to cold objects |
| temperature | temperatura | Measure of average particle motion |
Hook – The Hot City Mystery
Explore why urban areas are consistently warmer than rural surroundings.
Same Day, Different Temperature
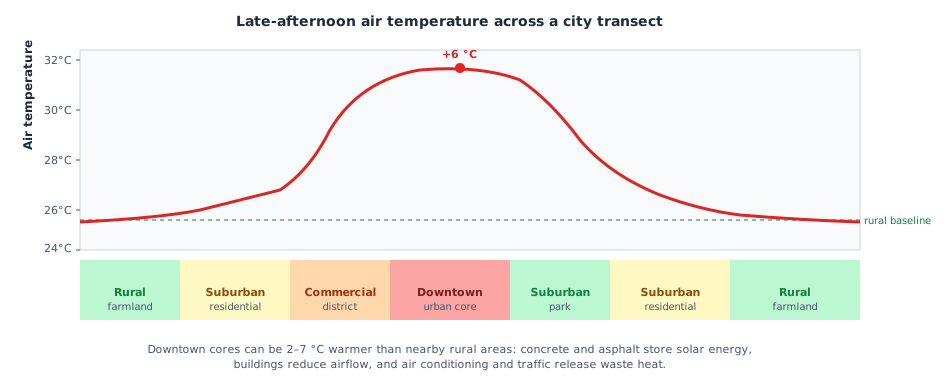
On a summer afternoon in St. Louis, weather stations record these temperatures simultaneously: downtown near the Gateway Arch (40 °C), the Shaw neighborhood (37 °C), Kirkwood suburb (34 °C), and Weldon Spring rural area (31 °C). The forecast said 33 °C everywhere. Why is downtown nearly 10 °F hotter than the farm 25 miles west? The Sun shines on all of them equally. What's different?
Weeks 1 & 2 → Week 3 Synthesis
What You'll Do This Week
- Investigate surface albedo — how do dark vs. light surfaces absorb radiation differently?
- Analyze real St. Louis temperature maps to identify urban heat island hotspots
- Design a neighborhood cooling intervention for a specific North City St. Louis block
- Synthesis Review: Connect W1–W3 thermal principles for the assessment
Worked Example – Reading Urban Temperature Data
1
Worked Example: Identifying Urban Heat Islands from Temperature Maps
Problem: A thermal satellite image of St. Louis taken on a summer day at 3 PM shows temperatures ranging from 28 °C (green, Forest Park) to 42 °C (red, downtown industrial district near the riverfront). Identify the heat island hotspots and explain which heat transfer mechanism primarily drives the temperature difference at each location.
Analysis Steps
- Identify hotspots: Look for areas above 37 °C (red/orange on thermal maps). In St. Louis, these cluster around I-70 interchange near downtown, the North City industrial corridor, and large parking lots in the County strip-mall corridor.
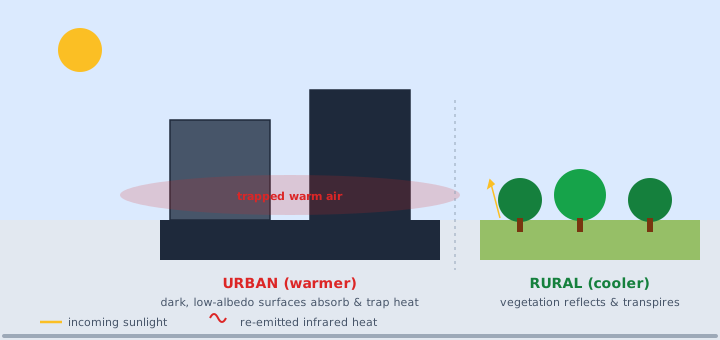
- Radiation analysis: Dark asphalt parking lots and black tar roofs have albedo values near 0.05 — they absorb 95% of solar radiation. Grass and forest have albedo ~0.25 (absorbs 75%). The difference explains why Forest Park (abundant green space) is 6–8 °C cooler than nearby downtown.
- Conduction analysis: Concrete sidewalks and asphalt roads have high thermal conductivity — they quickly absorb surface heat and conduct it into the sub-surface, then slowly re-radiate it after sunset. This is why cities stay warm late at night.
- Convection reduction: Dense urban canyons (tall buildings close together) block wind, reducing the convective cooling that naturally sweeps heat away from open fields.
- Conclusion: The 14 °C temperature difference between Forest Park and downtown is caused by all three mechanisms working together — not just one.
Station 1 – Surface Properties & Albedo Investigation
Investigate how surface properties determine heat absorption and radiation.
Station 1 — Albedo: Why Do Colors Matter?
Albedo (from the Latin for "whiteness") measures how much solar radiation a surface reflects. Black asphalt reflects ~5%; white concrete reflects ~50%; fresh snow reflects ~85%. These differences are the primary driver of urban heat islands. You'll use a virtual radiation simulator to test 6 surface types, measure temperature gain over 30 minutes under equal solar intensity, and calculate albedo from reflected vs. absorbed radiation data.
Surface Types to Test
- Black asphalt (standard road surface)
- White-painted "cool roof" material
- Dry grass/lawn
- Moist soil (park/garden)
- Concrete sidewalk (gray)
- Water/pond surface
Spiral (W2 specific heat): Water has high specific heat AND moderate albedo. Explain why rivers and ponds are natural "cool zones" in cities using both concepts.
Station 2 – Urban Heat Analysis
Analyze temperature data patterns to identify urban heat island hotspots.
Station 2 — Mapping the Hot Zones in St. Louis
You'll analyze a dataset of neighborhood temperature readings taken across St. Louis County and City during a summer heat wave (July 2023, peak: 38 °C regional average). The dataset includes afternoon surface temperatures, percentage of impervious surface (asphalt + concrete), percentage tree canopy cover, and median household income for 20 St. Louis neighborhoods.
Data Analysis Tasks
- Graph: Plot surface temperature (y-axis) vs. % impervious surface (x-axis) for all 20 neighborhoods. Describe the pattern.
- Graph: Plot surface temperature vs. % tree canopy cover. Describe the pattern.
- Identify outliers: Which 3 neighborhoods are hottest? Which 3 are coolest? What physical features explain the difference?
- Justice analysis: Plot temperature vs. median household income. What pattern do you find? What does this tell you about who bears the greatest burden of the urban heat island effect in St. Louis?
Station 3 – Design a Cool City Solution
Apply thermal principles to design an urban cooling intervention.
Station 3 — Design a Micro-Cooling Intervention for North City
The city of St. Louis has allocated $200,000 to cool a 4-block area in the Walnut Park East neighborhood (63115), which recorded temperatures 5 °C above the city average during the July 2023 heat wave. Your engineering team must design a cooling intervention that is community-accessible, scientifically grounded in thermal principles, and effective for residents who may not have air conditioning.
Available Interventions (mix and match within budget)
- Cool pavement coating (reflective surface treatment): $15,000/block — addresses radiation absorption
- Street tree planting (shade + evapotranspiration): $8,000/block for 20 trees — addresses radiation and convection
- Green roof installation on community center: $40,000 — addresses conduction and insulation
- Spray misting station (evaporative cooling at bus stops): $5,000 each — addresses convection cooling through phase change
- Community cooling center (insulated, energy-efficient): $80,000 — addresses access to thermally safe spaces
DOK-4 Synthesis
Part 3 — Misconception Check
Targeted check of the most common misconceptions from this cycle. (20 points, ~20 min)
Exit Ticket — Urban Heat Systems Mastery Check
Demonstrate your Week 3 mastery in 2 NEW questions on albedo and urban heat island mechanisms; 2 SPIRAL questions synthesizing Week 1 heat transfer methods and Week 2 insulation concepts in an urban context; and 1 INTEGRATION question applying the SEP of Constructing Explanations and Designing Solutions — you'll evaluate two competing urban cooling designs and argue which better addresses the thermal physics of the urban heat island effect.
Enrichment & Extension
Go Deeper
Optional content if you finish early or want to go deeper.
Scientist Spotlight: Dr. Eugenia Kalnay
Dr. Eugenia Kalnay is an Argentine-American atmospheric scientist and Distinguished University Professor at the University of Maryland. She is one of the world's leading experts in weather prediction and climate modeling. In a landmark 2003 study published in Nature, Kalnay and her colleagues showed that surface warming in the continental United States is caused partly by the urban heat island effect — not just greenhouse gases. Their analysis of weather station data revealed that stations in growing urban areas showed warming trends significantly larger than rural stations, confirming that land-use change (more pavement, fewer trees) independently raises temperatures. Kalnay's work directly informs city planning decisions: if you want accurate climate data, you need to account for how human-built environments create their own local climate. Her research is the scientific foundation for the urban cooling interventions you designed in Station 3.
Environmental Justice: North City St. Louis is ~4 °F Hotter
A 2020 analysis using NASA satellite thermal data found that predominantly Black neighborhoods in North City St. Louis — including Walnut Park, Penrose, Mark Twain, and Baden — are consistently 3–5 °F (1.7–2.8 °C) hotter than predominantly white neighborhoods in West County on summer afternoons. The cause is measurable with the physics from this week: North City has lower tree canopy cover (12% vs. 35% in West County), higher impervious surface percentage, and fewer parks. Meanwhile, cooling center access is limited — in 2022, St. Louis had 23 designated cooling centers citywide, but only 4 were in ZIP codes 63112–63115 (North City), which together contain over 80,000 residents. During a 2012 heat event that killed 29 people in the St. Louis region, 22 of those deaths occurred in North City and East St. Louis — neighborhoods least able to escape the heat island. The physics you studied this week — albedo, convection cooling, evapotranspiration — are tools that cities can use to save lives, if they choose to deploy them equitably.
Week 3 Complete!